rqt_graph
rqt_graph is a graphical tool for visualizing the ROS 2 computation graph. It helps you see which nodes are running, which topics they publish or subscribe to, and how those connections are related.
Overview
ROS 2 systems are composed of nodes that communicate through topics, services, and actions. While command-line tools such as ros2 node list and ros2 topic info show this information textually, rqt_graph provides a visual overview of the node/topic graph.
It is especially useful when:
- checking whether expected nodes are running
- confirming publisher/subscriber connections
- understanding namespaces and remapped topic names
- identifying unexpected or missing connections
- explaining the structure of a ROS 2 system during development or debugging
Why It Matters
As a ROS 2 system grows, it becomes difficult to understand the communication structure from terminal output alone.
For example, the Publisher/Subscriber tutorial creates this relationship:
simple_publisher
      |
      | /tutorial_chatter
      v
simple_subscriber
rqt_graph lets you inspect this relationship visually and verify that the nodes and topic are present in the ROS 2 graph.
See Publisher/Subscriber for the example used below.
Core Concepts
ROS 2 Graph
The ROS 2 graph describes the currently discovered communication entities in the system, including:
- nodes
- topics
- publishers
- subscriptions
- services
- actions
rqt_graph focuses primarily on visualizing node and topic relationships.
Graph Visibility Does Not Guarantee Data Flow
Seeing a publisher and subscriber in rqt_graph confirms that ROS 2 has discovered the graph entities, but it does not guarantee that messages are actually being delivered.
For example, communication can still fail because of:
- incompatible QoS settings
- type mismatches
- timestamp or TF problems in downstream processing
- application-level logic
Use rqt_graph together with command-line inspection tools when debugging.
Hands-on Steps
1. Start the Publisher and Subscriber
Use the nodes created in Publisher/Subscriber.
In one sourced terminal:
ros2 run my_ros2_tutorial simple_publisher
In a second sourced terminal:
ros2 run my_ros2_tutorial simple_subscriber
2. Start rqt_graph
In a third sourced terminal:
ros2 run rqt_graph rqt_graph
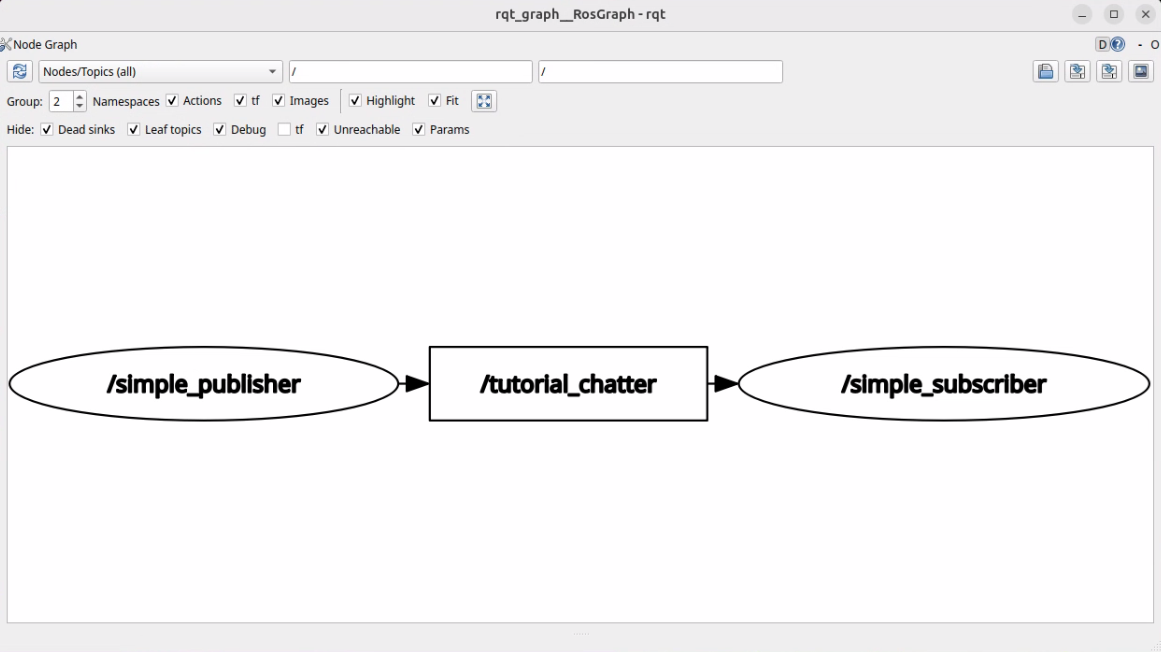
3. Inspect the Graph
You should see the publisher and subscriber connected through the /tutorial_chatter topic.
Depending on the selected view options, ROS 2 system topics or internal graph entities may also be shown.
Use the available filtering options to simplify the graph when many nodes are running.
Expected Result
For the Publisher/Subscriber example, the graph should show a relationship similar to:
/simple_publisher
       |
       | /tutorial_chatter
       v
/simple_subscriber
This confirms that both nodes and the topic have been discovered in the ROS 2 graph.
To verify actual communication, also check:
ros2 topic echo /tutorial_chatter
or:
ros2 topic info /tutorial_chatter -v
Useful Commands
# Start rqt_graph
ros2 run rqt_graph rqt_graph

# List discovered nodes
ros2 node list

# List topics and their types
ros2 topic list -t

# Inspect publishers, subscribers, and QoS
ros2 topic info <topic_name> -v

# Inspect one node
ros2 node info <node_name>
Common Problems
- Expected node does not appear — confirm that the node is actually running and that the terminal running
rqt_graphuses the same ROS 2 environment andROS_DOMAIN_ID. - Expected topic connection does not appear — verify the fully resolved topic name and namespace with
ros2 topic listand inspect the node withros2 node info. - The graph is difficult to read — use the filtering and view options in
rqt_graphto hide unnecessary system topics or nodes. - The connection appears but no messages are received —
rqt_graphshows graph discovery, not guaranteed message delivery. Check message type and QoS compatibility withros2 topic info <topic_name> -v. See Troubleshooting. - rqt_graph does not start — confirm that the package is installed and that the ROS 2 environment is sourced.
Key Takeaways
rqt_graphvisualizes the ROS 2 node/topic graph.- It is useful for understanding communication structure and discovering missing or unexpected connections.
- A visible graph connection does not by itself prove that messages are being delivered successfully.
- Combine
rqt_graphwithros2 node,ros2 topic, and troubleshooting tools for deeper diagnosis.
Next
Continue to rqt_console to inspect and filter ROS 2 log messages, or return to Troubleshooting when a graph connection is missing or communication is not working as expected.