rqt_console
rqt_console is a graphical tool for viewing and filtering ROS 2 log messages. It is useful for monitoring node behavior, finding warnings and errors, and separating relevant messages from a busy multi-node system.
Overview
ROS 2 nodes can emit log messages at different severity levels, such as:
DEBUGINFOWARNERRORFATAL
By default, ROS 2 nodes publish log messages to the /rosout topic in addition to other configured logging outputs. rqt_console provides a graphical interface for inspecting these messages and filtering them by properties such as severity, node, and message content.
For example, the Publisher/Subscriber tutorial uses:
self.get_logger().info(f'Publishing: "{msg.data}"')
and:
self.get_logger().info(f'Received: "{msg.data}"')
These log messages can be inspected in rqt_console.
See Publisher/Subscriber for the example used below.
Why It Matters
Terminal output is often sufficient for one or two nodes, but larger ROS 2 systems can generate many log messages at once.
rqt_console helps you:
- focus on warnings and errors
- inspect logs from a specific node
- search for repeated messages
- compare messages from multiple nodes
- monitor a running system without switching between many terminals
It is especially useful when debugging launch files or multi-node applications.
Core Concepts
/rosout
/rosout is the standard ROS 2 topic used for aggregated logging information.
Its message type is:
rcl_interfaces/msg/Log
Unlike plain terminal text, each /rosout message contains structured fields such as the logger name, severity level, message text, source file, function, and line number when that information is available.
You can inspect the topic directly with:
ros2 topic echo /rosout
rqt_console presents the same logging stream in a more convenient graphical interface.
Log Severity
ROS 2 logging levels indicate the importance of a message:
| Level | Typical use |
|---|---|
DEBUG | detailed diagnostic information |
INFO | normal runtime information |
WARN | unexpected condition that may require attention |
ERROR | operation failed or a serious problem occurred |
FATAL | severe failure after which the node may not continue normally |
A node's effective logging configuration determines which messages are emitted.
Hands-on Steps
1. Start the Publisher and Subscriber
Use the nodes created in Publisher/Subscriber.
In one sourced terminal:
ros2 run my_ros2_tutorial simple_publisher
In a second sourced terminal:
ros2 run my_ros2_tutorial simple_subscriber
Both nodes generate INFO log messages while they run.
2. Start rqt_console
In a third sourced terminal:
ros2 run rqt_console rqt_console
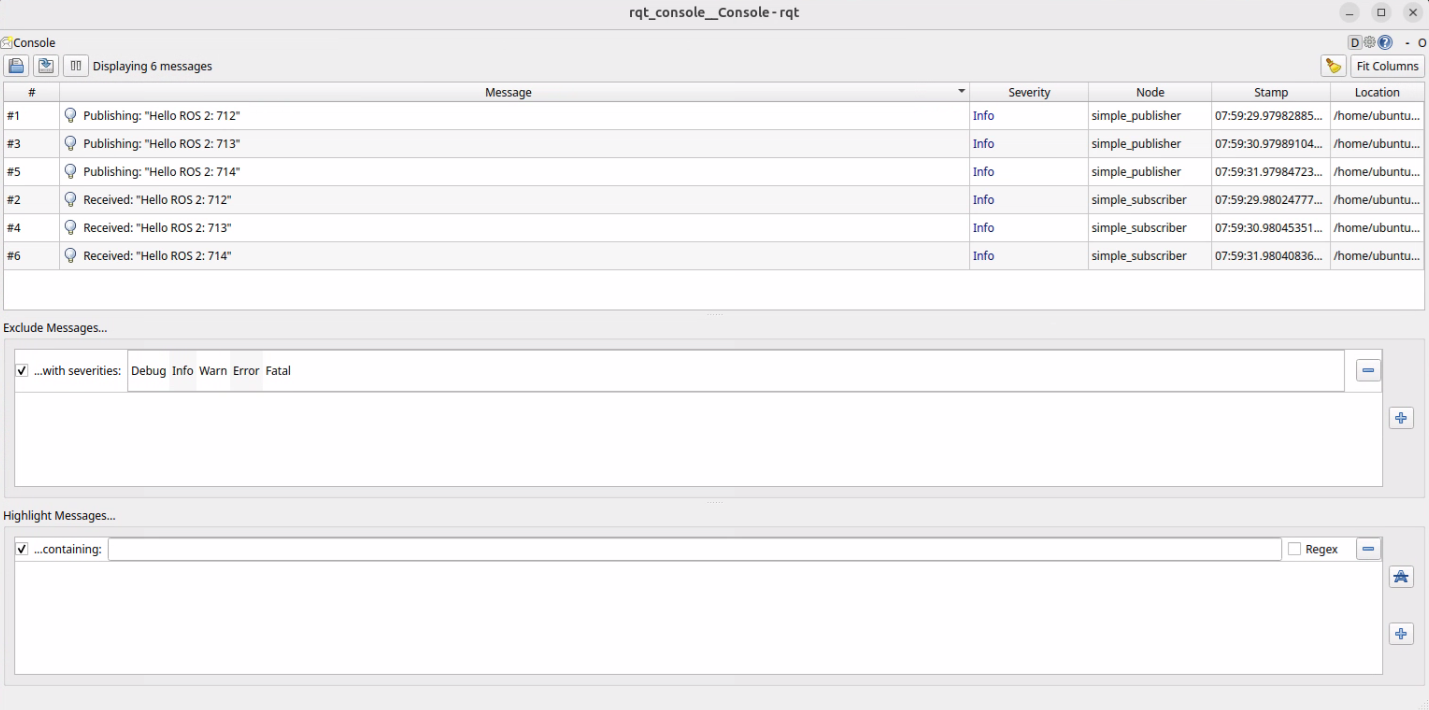
3. Inspect the Log Messages
You should see messages from nodes such as:
/simple_publisher
/simple_subscriber
with messages similar to:
Publishing: "Hello ROS 2: 0"
Received: "Hello ROS 2: 0"
4. Filter the Output
Use the filtering controls in rqt_console to reduce the displayed messages.
Typical filters include:
- severity level
- node or logger name
- message content
For example, you can show only warnings and errors when investigating a problem in a large system.
Expected Result
With the Publisher/Subscriber example running, rqt_console displays the log messages generated by both nodes.
As new messages are published and received, new INFO entries appear in the console.
You can also confirm that /rosout is active with:
ros2 topic info /rosout
or inspect the structured log messages directly:
ros2 topic echo /rosout
Useful Commands
# Start rqt_console
ros2 run rqt_console rqt_console

# Confirm /rosout exists
ros2 topic list | grep rosout

# Inspect /rosout
ros2 topic info /rosout
ros2 topic echo /rosout

# Inspect a node
ros2 node info <node_name>

# Run a node with a selected log level
ros2 run <package> <executable> --ros-args --log-level debug
Common Problems
- No messages appear in rqt_console — confirm that the expected nodes are running and that they are emitting log messages. Also check that the
rqt_consoleterminal uses the same ROS 2 environment andROS_DOMAIN_ID. /rosoutis not visible — logging to/rosoutmay be disabled for the node, or the node may not be running. Confirm withros2 topic list.- Too many messages make the console difficult to read — use severity, node/logger, or message-content filters to narrow the view.
- DEBUG messages do not appear — the node's effective log level may be higher than
DEBUG. Start or configure the node with an appropriate log level if detailed diagnostics are required. - Messages appear in the terminal but not in rqt_console — verify that the messages are ROS 2 logger output rather than ordinary
print()output, and confirm that/rosoutlogging has not been disabled.
Key Takeaways
rqt_consoleprovides a graphical view of ROS 2 log messages.- ROS 2 log messages are normally available on
/rosoutas structuredrcl_interfaces/msg/Logmessages. - Filtering by severity, node/logger, and message content makes large systems easier to debug.
rqt_consoleshows ROS 2 logger messages; ordinary process output such asprint()is not automatically part of/rosout.- Combine
rqt_consolewith rqt_graph and Troubleshooting when diagnosing multi-node systems.
Next
Continue to Gazebo for robot simulation, or return to Troubleshooting when log messages point to communication, TF, timing, or environment problems.