System Monitor on ASR-D501
This guide demonstrates how to retrieve hardware metrics and monitor the system resources and thermal status on the ASR-D501.
Overview
- Lightweight Extraction: Reads data directly from Linux virtual files.
- Comprehensive Metrics: Tracks real-time CPU usage and temperatures across critical components, including CPU, GPU, NPU/NSP, and DDR.
- Dashboard Visualization: Uses a custom Python-based dashboard to easily monitor live hardware loads and system thermal states.
System Requirements and Components
| Component | Specification |
|---|---|
| Platform | ASR-D501 (Qualcomm QCS6490) |
| OS Image | ASRD501A1-Ubuntu24.04-x07_v1.0.0 |
Workflow
- Step 1: Retrieve system metrics
- Step 2: Download and run the Python monitor script
Step 1: Retrieve system metrics
In Linux systems, hardware status is often mapped to virtual files. We can obtain real-time information by directly reading these files.
1. Reading Chip Temperatures (Thermal Zones)
Temperature nodes for various chips on the board (including CPU, GPU, NPU/NSP, and DDR) are located in the /sys/class/thermal/ directory.
- Each sensor corresponds to a
thermal_zonefolder. - The
typefile within each folder records the name of the node (e.g.,cpu0-thermalorgpuss0-thermal). - The
tempfile stores the raw temperature value. Dividing this value by 1000 gives the actual temperature in Celsius (°C).
2. Calculating CPU Usage
The CPU's running states are recorded in the /proc/stat file.
- By reading the first line of this file (which starts with
cpu), you can acquire the system's total "idle time" and "non-idle time". - To accurately calculate the current CPU usage percentage, simply take two samples over a short interval (e.g., 1 second) and calculate the difference in both the total time and idle time between the two samples.
Step 2: Download and run the Python monitor script
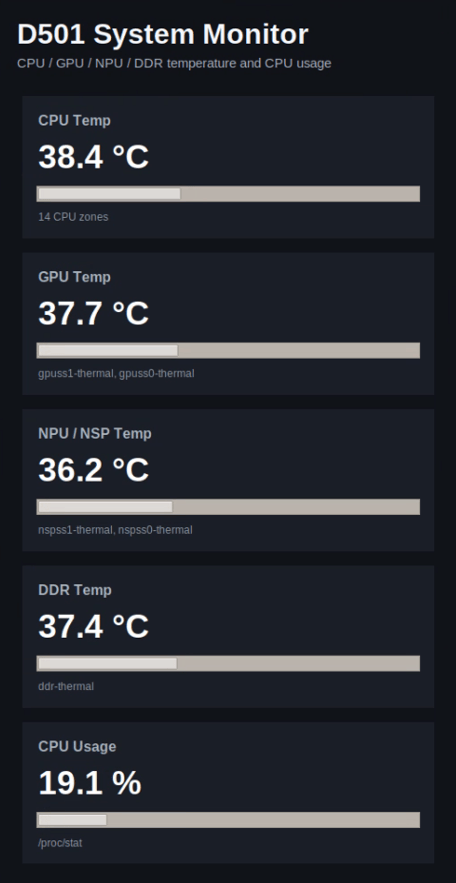
To make the data easier to observe, we implemented a simple graphical interface using Python. This dashboard refreshes the data every 1000 milliseconds (1 second), allowing you to monitor key system metrics at a glance.
The dashboard covers the following metrics:
- CPU Temp: Displays the maximum CPU temperature and the number of CPU thermal zones.
- GPU Temp: Displays the Graphics Processing Unit temperature.
- NPU/NSP Temp: Displays the Neural Processing Unit / Neural Signal Processor temperature.
- DDR Temp: Displays the memory temperature.
- CPU Usage: Real-time overall CPU usage percentage.
Download the Python file and run
We have integrated the data extraction logic and the UI into a single Python script.
Please use the link below to download the system monitor code:
📥 Download system_monitor.py
Once downloaded, open a terminal on your device and run the following command to launch the monitor panel:
python3 system_monitor.py
You should now see the monitor panel displaying the real-time system data!